


 352 / 916

S348
25th European Congress of Psychiatry / European Psychiatry 41S (2017) S303–S364
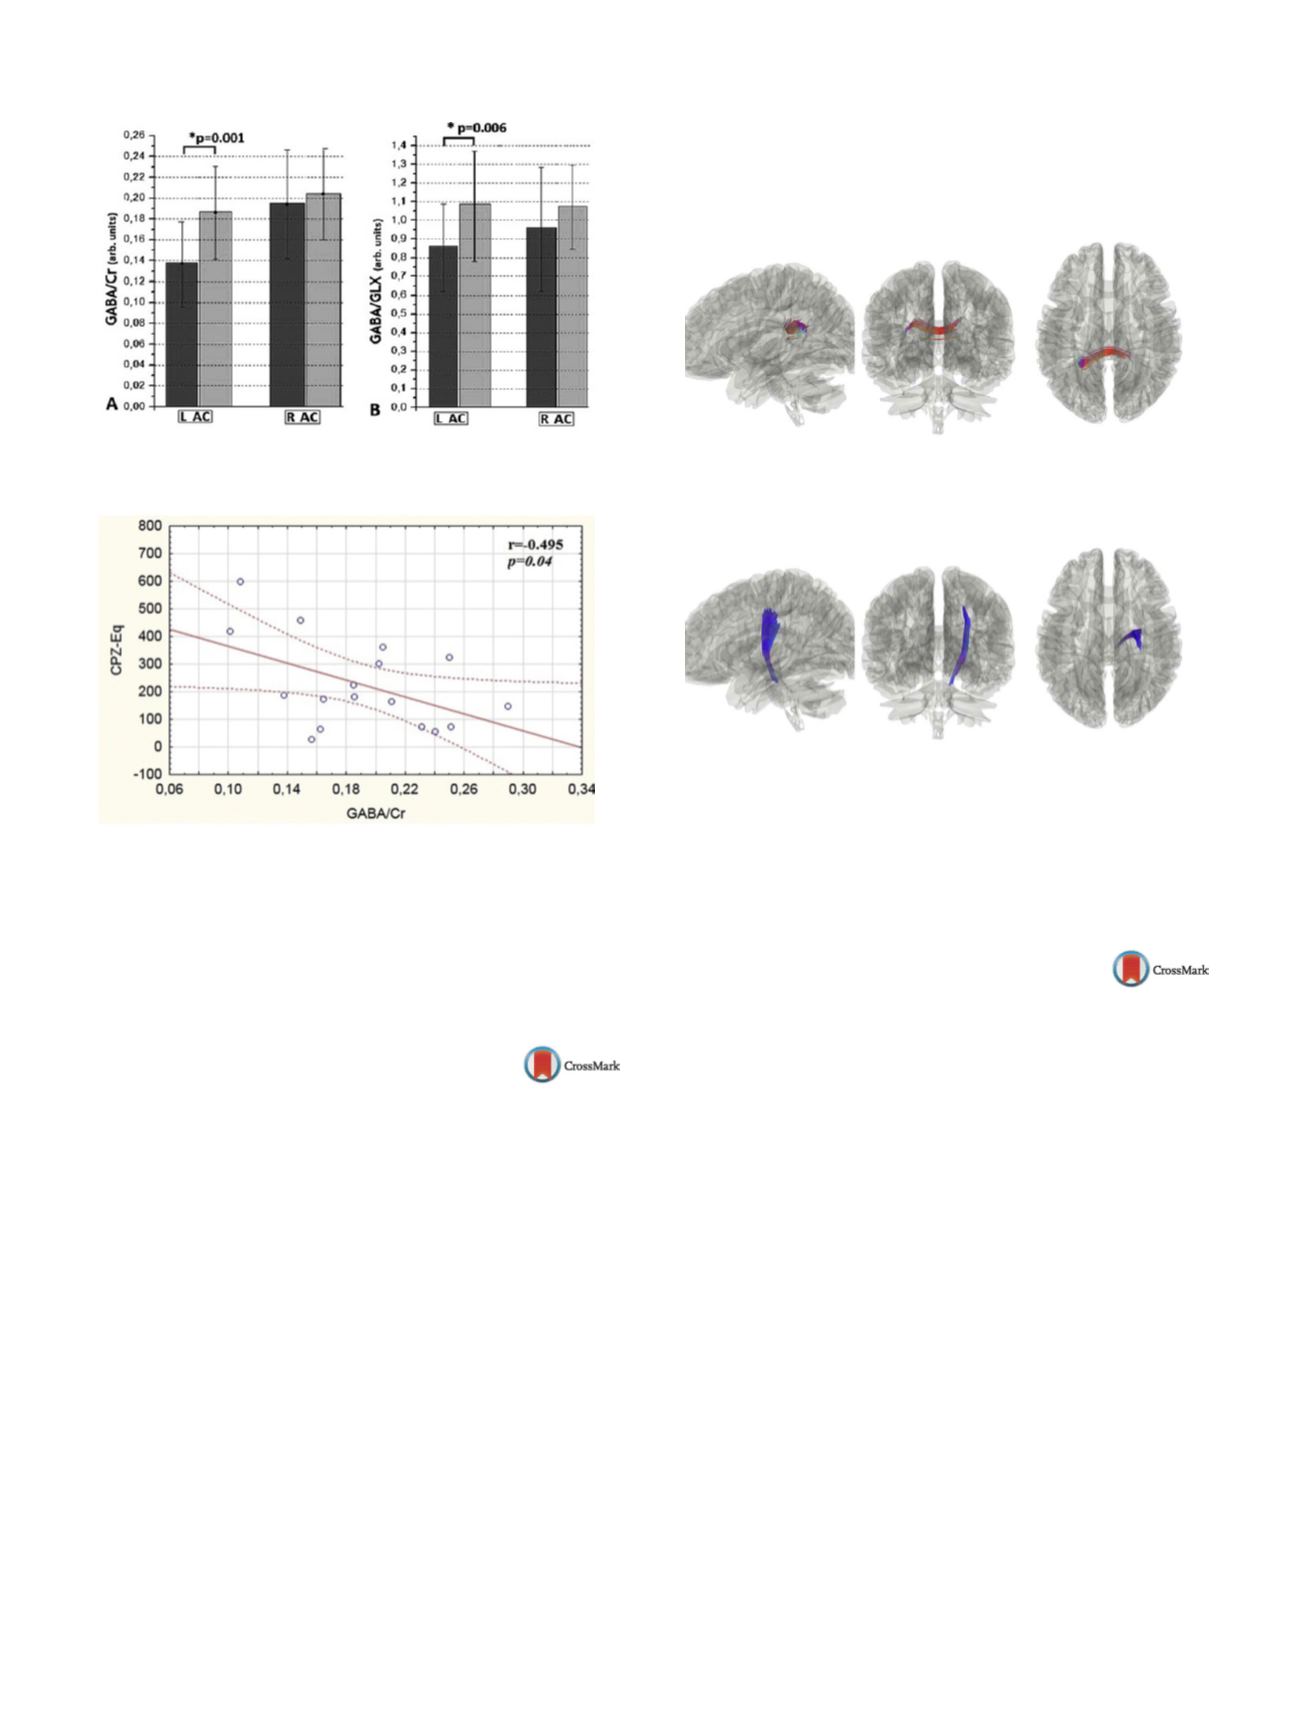
Fig. 2
Reduced GABA (A) and GABA/GLX (B) in the left ACC.
Fig. 3
Association between GABA/Cr and treatment.
Disclosure of interest
The authors have not supplied their decla-
ration of competing interest.
http://dx.doi.org/10.1016/j.eurpsy.2017.02.319EW0706
Connectivity differences between
bipolar disorder, unipolar depression
and schizophrenia
S. Metin
1 ,∗
, B. Metin
2, C. Tas
2, N. Tarhan
21
Uskudar university, psychiatry, Istanbul, Turkey
2
Uskudar university, psychology, Istanbul, Turkey
∗
Corresponding author.
Introduction
Diffusion tensor imaging (DTI) is used frequently
to explore white matter tract morphology and connectivity in
psychiatric disorders. Connectivity alterations were previously
reported for bipolar disorder, unipolar depression and schizophre-
nia. However, there is limited data on how these disorders differ
from one another in terms of connectivity.
Aims
In this study, we aimed to explore connectivity differences
between these disorders.
Methods
We analyzed DTI data of 37 patients with schizophre-
nia, 41 patients with bipolar disorder and 46 patients with unipolar
depression. Group analyses were performed for schizophrenia ver-
sus bipolar and bipolar versus unipolar contrasts with using age as
a covariate.
Results
Threshold corrected results showed that connectivity
at internal capsule and corpus callosum were most distinctive
between groups. For corpus callosum (splenium), unipolar group
showed the highest connectivity and schizophrenia group showed
the lowest connectivity
( Fig. 1 ).For internal capsule, schizophre-
nia group had the highest connectivity and unipolar group had the
lowest connectivity
( Fig. 2 ).Bipolar group had intermediate values
for both tracts.
Conclusions
These results indicate that connectivity analysismay
be helpful for differentiating psychiatric disorders.
Fig. 1
Fig. 2
Disclosure of interest
The authors have not supplied their decla-
ration of competing interest.
http://dx.doi.org/10.1016/j.eurpsy.2017.02.320EW0707
Time-frequency analysis of EEG
recorded during unconscious
expectation of angry vs. neutral faces
in patients with major depression and
healthy controls
E. Mnatsakanian
1, M. Sharaev
2, V. Krjukov
3, O. Antipova
3,
V. Krasnov
3 ,∗
1
Moscow research institute of psychiatry, neurophysiology, Moscow,
Russia
2
National research centre “Kurchatov institute”, neuroimaging,
Moscow, Russia
3
Moscow research institute of psychiatry, affective disorders,
Moscow, Russia
∗
Corresponding author.
Introduction
The knowledge on brain mechanisms of psycho-
pathology can be very useful for the diagnosis and treatment of
patients.
Objectives
Patients with major depressive disorder (MDD) show
attention bias to the negative emotional stimuli. Automatic
(unconscious) emotional processing in such patients may become
a prospective biomarker for depression.
Aims
We aimed at studying the EEG-correlates of unconscious
expectation of angry human faces in MDD patients compared to
healthy controls.
Methods
128-channel EEGwas recorded inMDD (23 females and
7 males) and in healthy volunteers (22 females and 8 males) while
they categorized pictures as humans or animals. Half of the pictures
were neutral and half were showing the faces of angry humans or
animals. The pictures were preceded by cues (one for each cate-
gory), which meaning was not explained to the participants. We